Article

Content of Acidic Compounds in the Bean of Coffea arabica L., Produced in the Department of Cesar (Colombia), and Its Relationship with the Sensorial Attribute of Acidity

by
Luz Fanny Echeverri-Giraldo
1,*,
Valentina Osorio Pérez
1,
Claudia Tabares Arboleda
1,
Lady Juliet Vargas Gutiérrez
1 and
Luis Carlos Imbachi Quinchua
2
1
Department of Quality, National Coffee Research Center, Cenicafé. Km 4 Chinchiná—Manizales, Manizales 170009, Colombia
2
Department of Biometrics, National Coffee Research Center, Cenicafé. Km 4 Chinchiná—Manizales, Manizales 170009, Colombia
*
Author to whom correspondence should be addressed.
Separations 2024, 11(2), 52; https://doi.org/10.3390/separations11020052
Submission received: 16 November 2023 / Revised: 16 January 2024 / Accepted: 3 February 2024 / Published: 7 February 2024
(This article belongs to the Special Issue Bioactive Compounds in Foods: Separation, Extraction and Application)

Abstract

:
Cesar, a coffee-growing department in Colombia, has particular characteristics that favor the production of coffees differentiated by sensory profile, for which the acidity attribute stands out. The chemical composition and sensory quality of the coffee produced by 160 coffee growers during two production harvests (2021 and 2022) and processed by the wet method were evaluated to correlate the contents of the main acidic chemical compounds present in green coffee beans with the perceived acidity of the beverage. The chemical analysis of coffee samples utilized spectrophotometric methods and HPLC-DAD techniques. Lactic, 3,5-di-CQA and phosphoric acids were good discriminators of acidity classified as excellent; that is, with a score higher than 7.75 on the Specialty Coffee Association (SCA) scale, presenting the highest contents in the green coffee bean. There was a direct linear relationship between acidity and 3,5-di-CQA and 5-CQA and an inverse relationship between acidity and 3-CQA, 4-CQA and 4,5-CQA. These findings contribute to the understanding of the quality and chemistry of Colombian coffee.

1. Introduction

Colombia is the world’s largest producer of smooth washed Arabica coffee and is recognized for its coffee quality, giving coffee produced in Colombia additional value in commercialized prices. The income of more than 540,000 coffee-growing families in Colombia derives from the production of coffee; coffee is grown in more than 600 municipalities of the 23 coffee departments of the country, and according to figures from the Ministry of Agriculture, the coffee sector in Colombia represents 15% of GDP agriculture, creating approximately 2.5 million jobs (direct and indirect). In 2022, the total coffee production reached 11.1 million 60 kilogram bags of green coffee. Out of this, 11.4 million bags were exported, and 2.3 million bags were consumed in Colombia [1].
Cesar is one of 23 coffee departments of Colombia, with a coffee cultivation area of 23,589 ha and an average density of 5126 plants/ha; it has 8764 coffee farms and a population of 8417 coffee growers, distributed in 19 municipalities of the department [2]. Eighty percent of the crops are concentrated in four municipalities, Valledupar and Pueblo Bello, in Sierra Nevada de Santa Marta, and Agustín Codazzi and La Paz, in Serranía del Perijá (eastern mountain range).
The department of Cesar, located in northern Colombia, is 43% mountains and 57% plains, with warm weather in flat areas, a temperate climate in mountainous areas, and a moorland climate in Sierra Nevada de Santa Marta and Serranía de Perijá [3]. The climate effects lead to a concentrated harvest pattern in the second half of the year, with 90% of the harvest between the months of October and December and the remaining 10% in the months of January and February; additionally, the climate necessitates adopting a production system under the shade, except at altitudes above 1600 m, where it is possible to produce coffee in full sun exposure [3].
The quality of Colombian coffee is the result of the cultivation of varieties of the Arabica species, in combination with environmental (soil and climate) factors associated with the geography and location of Colombia; agronomic practices during the stages of sowing, fertilization, and the integrated management of pests, diseases and weeds [4,5,6,7,8]; and harvesting mainly ripe fruits and implementing wet processing [9,10,11,12,13]. The wet process to obtain washed coffee has more processing stages than does the dry process used to obtain natural coffee or the semidry process used to obtain honey type coffee; each of these processes yields beverages with sensory attributes differentiated by fragrance and aroma, acidity and body [14,15,16].
Wet processing, which is carried out by the majority of Colombian coffee growers, begins with the harvest of ripe fruits [15,17,18,19]. Then, pulping, considered the first stage of transformation, involves removal of the peel from the fruit [20] and the elimination of mucilage from coffee [21,22,23,24]; mucilage is the hydrogel that covers the shelled bean and, in combination with yeasts and bacteria present in the environment and in the equipment, leads to the natural occurrence of fermentation at room temperature [15,25]. After the spontaneous fermentation stage [26], the coffee is washed, followed by the drying process until it reaches a moisture content between 10–12% [27,28,29].
All these factors and processes contribute to the formation of chemical compounds in green coffee beans; the compounds are expressed or transformed into other chemical compounds during the roasting process through different chemical reactions that occur inside the bean [4,6,12,30,31,32,33], giving rise to different sensory attributes, i.e., fragrance/aroma, flavor, acidity, sweetness and body, in the beverage. Each sensory attribute can be evaluated quantitatively based on quality and intensity and qualitatively through descriptions [14].
Acidity is one of the outstanding attributes of the coffee beverage and is most valued by consumers worldwide. It is described as the sensation on the tongue that causes salivation and contributes to the liveliness of the beverage, imparting characteristics of fresh fruit. Acidity, strictly speaking, is determined solely by the concentration of hydrogen ions (pH), which is related to the degree of ionization or dissociation of an acid present in a solution; undissociated molecules of acids can have a flavor effect through aroma by virtue of their volatility [34].
From a sensory perspective, certain groups of acids are considered constituents of coffee beans that directly affect beverage quality; these acids constitute 11% of the total bean mass, and they are flavor precursors for other coffee quality descriptors. Two groups of acids have been identified in coffee beans: organic acids (OAs), such as citric, malic, quinic, acetic, lactic, succinic and oxalic acids [15,30,33,35,36,37], and chlorogenic acids (ACGs), grouped as caffeoylquinic acids (5-CQA, 4-CQA and 3-CQA), feruloylquinic acids (5-FQA, 4-FQA and 3-FQA) and dicaffeoylquinic acids (3,4-diCQA; 3,5-diCQA and 4,5-diCQA) [32,38,39,40,41]. Among other acids present in coffee beans, inorganic acids such as phosphoric acid (H3PO4) have been identified [42].
Farah et al. [43] indicated that chemical analyses of green coffee beans can be used as an additional tool to predict the sensory quality of the beverage. In view of the importance of certain groups of chemical compounds as precursors of different sensory attributes of the beverage, including acidity, this study was carried out to determine if there is a relationship between the content of acids present in green coffee beans and the quality of the acidity perceived in the beverage.
This research deepens our understanding of how chemically acidic compounds present in green coffee beans correlate with the sensory attribute of acidity in the beverage. These findings are particularly relevant for Colombian coffee farmers, gaining a deeper insight into how acids in green coffee beans processed through wet processing with spontaneous fermentation influence the sensory perception of acidity. This study actively promotes and highlights the distinctive qualities of coffee produced in the department of Cesar.

2. Materials and Methods

2.1. Coffee Samples and Origin

In total, 160 farms were randomly and proportionally selected from the 12 coffee municipalities in the department of Cesar (Figure 1a). The samples were obtained from coffee fruits of the species Coffea arabica L., variety Castillo®, processed by the coffee growers on their farms through the wet process with spontaneous fermentation. These samples were evaluated during two production harvests (2021–2023), totaling 320 samples. The process began with the harvesting and pulping of ripe fruits, followed by the classification by density of lower quality beans, and then the removal of mucilage through spontaneous fermentation. The Fermaestro TM methodology [26] was employed to monitor the degradation of mucilage and establish the optimum point at which the coffee should be washed. Subsequently, the coffee was naturally dried (sun-dried) until the beans reached a moisture content between 10% and 12% (Figure 1b). The dry parchment coffee (DPC) was collected by the Departmental Committee of Coffee Growers of Cesar and then sent to the National Coffee Research Center (CENICAFE). This center is located in the municipality of Chinchiná, Caldas, at an altitude of 1310 m and has an average temperature of 21.2 °C, along with a relative humidity of 82.3%.

2.2. Chemical Analysis

2.2.1. Chemicals and Solvents

All organic solvents used in this study were HPLC-grade (Sigma-Aldrich, St. Louis, MO, USA). The ultrapure (type 1) water used for the HPLC and UPLC mobile phases and preparation of standard solutions was obtained through a SMART 2 PURE 12 UV/UF (Thermo scientific, Waltham, MA, USA). Various acids were utilized in the study, each with specific characteristics. Citric acid ACS reagent (≥99.5%, 251275), Succinic acid (≥99.0%, S3674), L-Malic acid (≥95%, M6413), D-Quinic acid (≥95%, 138622), and Chlorogenic acid (≥97%, C3878) were sourced from Sigma-Aldrich (St. Louis, MO, USA). Lactic acid—Certified Reference Material (PHR1215) by Supelco. Carrez clarification solutions I and II were obtained as a ready-to-use kit (Sigma-Aldrich, St. Louis, MO, USA).

2.2.2. Sample Preparation

The DPC samples were threshed to obtain coffee beans. The selection of beans was carried out by removing beans with physical defects to obtain healthy grains, minimizing the interference of other types of beans. Subsequently, the beans were cryogenically ground in liquid nitrogen using a Retsch ZM 200 ultracentrifuge mill. The ground samples were stored at −80 °C in a Thermo Scientific brand freezer until chemical analyses were performed.

2.2.3. Extraction, Analysis and Quantification of Chemical Compounds

  • Organic acids (OAs)
Extraction and quantification of organic acids were conducted following the protocol described by Santiago et al. [36] with modifications, and chromatographic conditions were adjusted according to the method provided by the column manufacturer [44]. OAs were extracted with water at 90 °C for 5 min. The analytes of interest were isolated and quantified using a high efficiency liquid chromatograph coupled to a diode array detector (Alliance 2690-996 DAD, Waters Corporation, Milford, CT, USA) and a Supelcogel C-610H column (300 mm × 7.8 mm, Supelco, Bellefonte, PA, USA); the separation parameters were as follows: temperature, 35 °C; flow rate, 0.5 mL/min; mobile phase, H3PO4 (0.1% v/v); and isocratic mode. The data were acquired using the Empower 2.0 controlling software. The DAD detector collected data in the range from 190 to 450 nm, and chromatograms were extracted at 210 nm for quantitation (Figure 2). The different acids (acetic, citric, lactic, malic, quinic and succinic acids) were quantified using calibration curves made with reference standards for each OA (Sigma-Aldrich). The method of external standards was applied for the quantitation of each compound. Analytical parameters of chromatographic methods (LOD, LOQ, and linearity range) for each standard were established (Table 1).
The organic acids were identified by comparing their retention time (in minutes) to standard values and quantified using external standard calibration. The chromatographic separation of each organic acid is depicted in Figure 2.
2.
Phosphoric acid
Green coffee beans (2 g) were milled. The ash was digested with 4 mL of a solution of HCl: water (1:1 v/v), followed by complete evaporation. The residue obtained was brought to a volume of 25 mL with hot water. A 0.5 mL aliquot of resuspended residue was added to 4.5 mL of water and 2 mL of a mixture of ammonium molybdate and ammonium vanadate (1: 1 v/v). The mixture was left to react for 10 min, and then the absorbance at 420 nm was read on a UV-VIS spectrophotometer (Beckman DU-650, Beckman Coulter, Brea, CA, USA). The phosphorus concentration in the sample was determined based on a calibration curve (1 to 16 mg L−1, Figure 3) made with monobasic potassium phosphate (Merck, Rahway, NJ, USA), following the methodology described by Carrillo et al. [45]. The data were expressed as the content of phosphorus present in the coffee beans and then converted to the content of phosphoric acid. All tests were carried out in triplicate.
3.
Chlorogenic acid isomers
The extraction method described below is based on that described by Marín and Puerta [38]. Chlorogenic acids were extracted from previously defatted coffee samples using 70% methanol and subsequent purification with Carrez I and II reagents. Analyses were performed on an ultra-performance liquid chromatograph (Acquity MQ, Waters Corp., Milford, MA, USA) coupled with a diode array detector (2998-DAD, Waters Corp., Milford, MA, USA). The parameters for the analysis included a wavelength range of 210–400 nm, with chromatograms extracted at 324 nm for quantitation (Figure 4). The column used was Acquity UPLC BEH C18 (1.7 µm, 2.1 mm × 50 mm, Waters Corp., Milford, MA, USA), maintained at a temperature of 40 °C. The mobile phase consisted of a mixture of acetonitrile (100% v/v) and phosphoric acid (0.1%) in a 10:90 ratio, with a flow rate of 0.6 mL/min in an elution gradient lasting 3.5 min. Chlorogenic acids (CQA, FQA, and diCQA) were identified by comparison of retention times in relation to 5-caffeoylquinic acid (Figure 4) and were quantified considering the concentration obtained for 5-CQA in the chromatogram, the molar absorptivity coefficients and the molecular weights of the respective acids, based on molar ratios reported in the literature [38,46,47].

2.3. Sensory Analysis

Prior to the sensory analysis, all the samples were roasted in Probat equipment (BRZ 2) for 8 to 12 min in a colorimetry range between 55–65 Agtron/SCA, and the roasted coffee beans were ground in Bunn G3 equipment. For each sample, 5 cups were evaluated at three different temperature levels in accordance with the protocol of the Specialty Coffee Association (SCA) [48].
This protocol is internationally recognized by the Coffee Quality Institute (CQI) and allows the recording of 10 coffee attributes: fragrance/aroma, flavor, aftertaste, acidity, body, balance, uniformity, clean cup, sweetness, presence of defects (clean cup). The total SCA score was the sum of all the attribute scores. These attributes are rated on a 16-point scale representing quality levels with increments of 0.25 between numerical values from 6 up to 9.75. To conduct this analysis, the taster must be certified as Q-Grader by the CQI.

2.4. Statistical Analysis

For each of the chemical compounds, the average and standard deviation were determined for each evaluated harvest. Of the 320 samples evaluated in the two harvests, those that did not present sensory defects were selected, and a multivariate principal component analysis (PCA) was carried out to identify relationships between the different chemical compounds and the acidity ranges established and evaluated by the cupping panel. Subsequently, to determine differences in chemical compounds and acidity ranges, a 5% multivariate t-multiple comparison test was performed. Finally, Pearson’s correlation coefficient was calculated to describe the linear relationships between chemical compounds and perceived acidity. Principal component analysis (PCA) and Pearson’s correlation coefficient were conducted using R version 4.2.1 (R Core Team, 2021, R Foundation for Statistical Computing, Vienna, Austria).

3. Results and Discussion

3.1. Acid Composition in Green Coffee Beans

Table 2 shows the results obtained from the chemical analyses carried out on the green coffee beans of C. arabica from the department of Cesar and processed by the coffee growers on their farm by wet means. The data are presented as the average and standard deviation obtained by each acid group for each of the evaluated harvests: phosphoric acid, organic acids and chlorogenic acids.
For OAs (Table 2), in general, citric acid (12.1 ± 1.6 g kg−1), quinic acid (6 ± 0.8 g kg−1), malic acid (4.4 ± 0.8 g kg−1) and acetic acid (4 ± 3 g kg−1) were the predominant acids; these data were within the average values reported for C. arabica grown in Colombia [15,30].
As observed descriptively, the variability of acetic acid does not remain consistent from one harvest to another. This change could be associated with post-harvest practices carried out by coffee growers in the wet process [15,49,50]. However, it was not the focus of this study to control these factors, and therefore, it is not possible to precisely determine the causes of the variability.
For C. arabica, Santiago et al. [36] reported citric acid values ranging from 7.48 to 13.43 g kg−1, quinic acid values ranging from 1.92 to 3.37 g kg−1, malic acid values ranging from 2.63 to 4.42 g kg−1 and acetic acid values ranging from 9.30 to 14.67 g kg−1.
Regarding phosphoric acid, no values have been reported for the coffee varieties grown in Colombia; the value obtained in this study ranged from 0.42 to 0.68 g 100 g−1, values similar to those reported by Khapre et al. [42] for C. arabica green coffee beans from Kenya, with contents ranging from 0.31 to 0.74% green coffee bean (dwb).
Among chlorogenic acids, caffeoylquinic acid (CQA) was predominant (Table 2), with an average content of 5.6 ± 0.4 g 100 g−1, corresponding to 83% of the total chlorogenic acids present in green coffee beans; within this group, the 5-CQA isomer had the highest content (4.7 ± 0.3 g 100 g−1). The other isomers within this group, i.e., 3-CQA and 4-CQA, had contents of 0.4 ± 0.1 and 0.5 ± 0.1 g 100 g−1, respectively. In the group of diCQAs, the isomer with the highest content was 3,5-diCQA (0.4 ± 0.1 g 100 g−1), and for the group of feruloylquinic acids (FQAs), the isomer with the highest average content was 5-FQA (0.37 ± 0.04 g 100 g−1).
The results are similar to those reported by Dong et al. [51] for green coffee beans of different origins, with values ranging from 0.23 to 0.47 g 100 g−1 for 3-CQA, from 0.39 to 0.65 g 100 g−1 for 4-CQA and from 3.55 to 4.92 g 100 g−1 for 5-CQA. Similar results were observed by other authors for C. arabica [32,39,40,51].

3.2. Sensory Analysis

The individual determination of each attribute was carried out in accordance with the methodology established by the SCA, and the total score was the sum of each attribute score. A total of 320 samples were evaluated for the two coffee harvests, and the data were grouped by classification category using the total scores (Figure 5). A total of 19.7% of the samples evaluated presented sensory defects, with scores below 60 SCA points, and 3.1% of the samples did not present sensory defects, but their score was less than 80 SCA points, classifying them as standard quality (not specialty). A total of 77.2% of the samples evaluated obtained scores equal to or greater than 80 SCA points, classifying them as specialty coffees [52].
One of the objectives of the SCA protocol is to differentiate specialty coffee from commercial or conventional coffee. The maximum possible score for this protocol is 100 points, and 80 points is the threshold for specialty coffee. Using this classification range established by the SCA [52], 77.2% of the 320 samples evaluated were classified as specialty coffees, of which 50% of the samples had scores greater than or equal to 80 SCA points but less than 83 points; a total of 24.4% of the samples had scores greater than or equal to 83 SCA points but less than 85; and 2.8% of the evaluated samples had scores equal to or greater than 85 SCA points but less than 90 SCA points.
Table 3 shows the average scores for each of the attributes evaluated during a sensory analysis of the 77.2% of samples that had scores higher than 80 SCA points. Further analyses were conducted to determine if the scores for these samples were correlated with the contents of different groups of acids present in green coffee bean.
The samples with a score higher than 80 points on average had scores higher than 7.25 for each attribute. For acidity, for the samples evaluated, the average score was 7.52 ± 0.20, with a minimum of 7.00 and a maximum of 8.25. For fragrance/aroma, the average score was 7.57 ± 0.21, and for flavor, the average score was 7.54 ± 0.24.

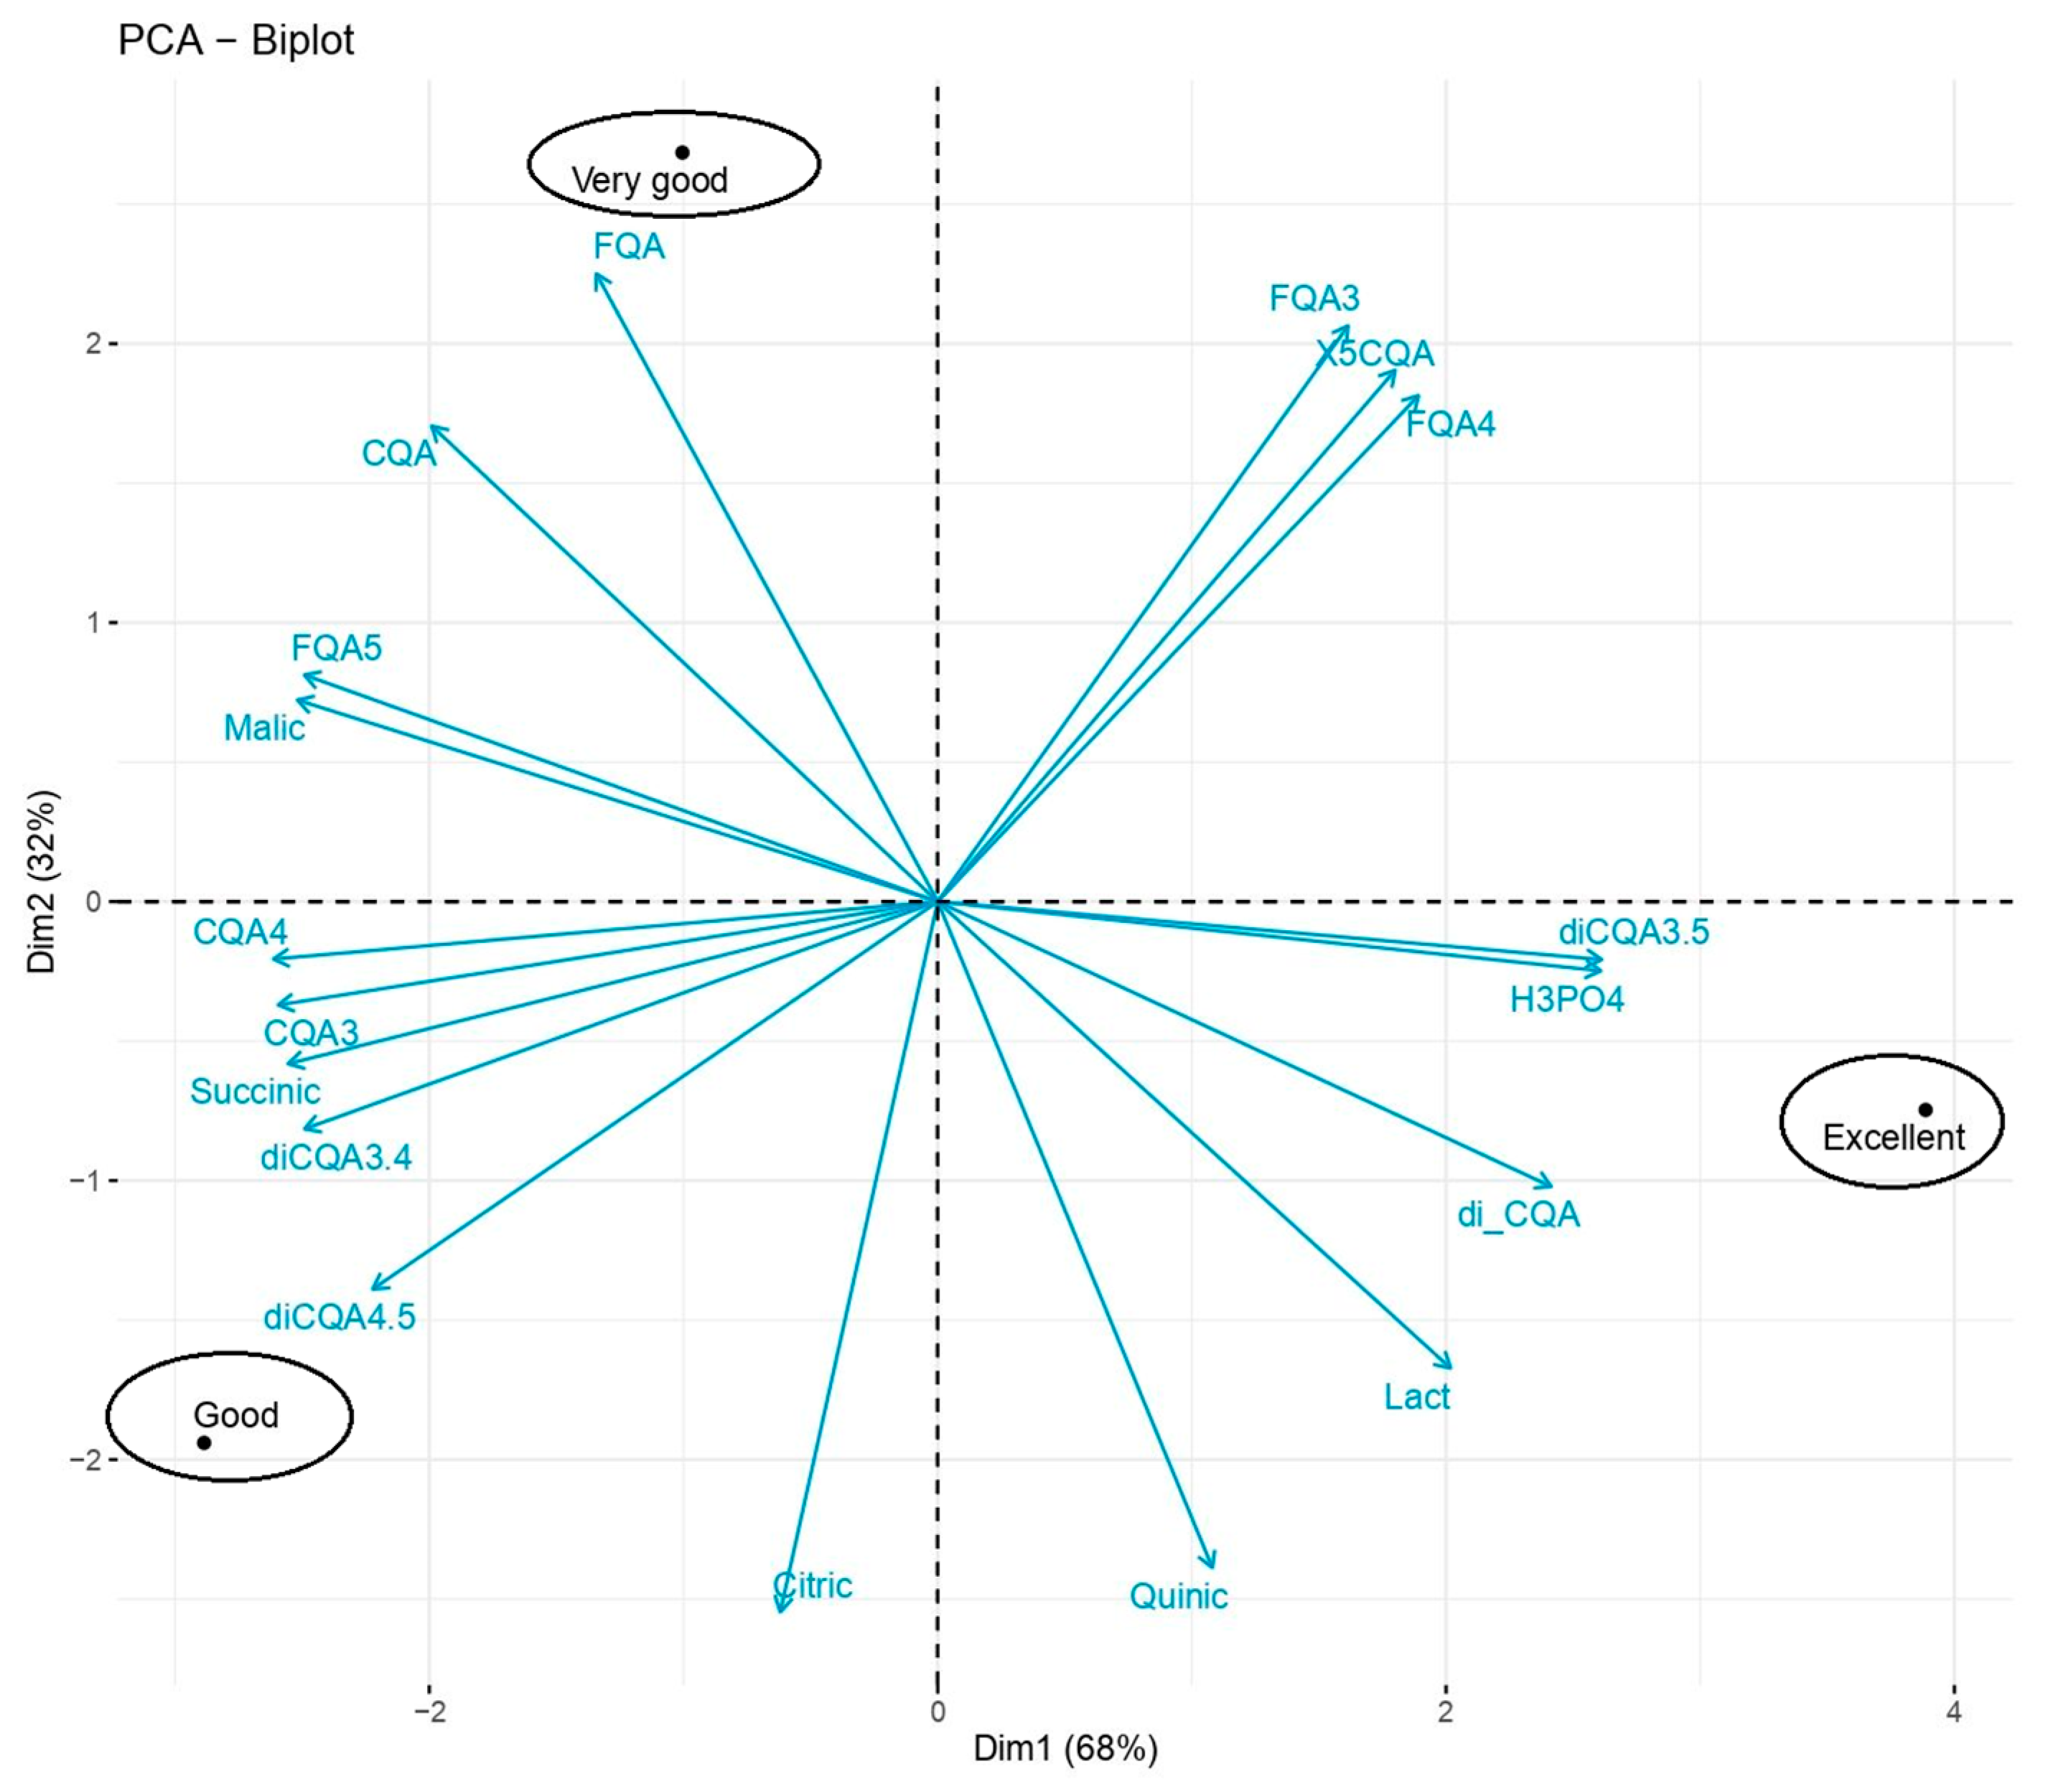
3.3. Relationship between Acid Composition in Green Coffee Beans and the Sensory Attribute of Acidity

In this study, acetic acid is not considered in the analysis of its relationship with the sensory attribute of acidity. The heterogeneity in the values recorded for this acid (Table 2) may be attributed to factors other than those investigated in this study. Therefore, only those acids that exhibited homogeneity in their concentration in both harvests will be taken into account.
For the 77.2% of samples with scores equal to or greater than 80 SCA points, classified as specialty coffees (specialty quality), a classification scale for acidity was developed by the authors (Table 4) to determine if there is a relationship between perceived acidity perceived by the Q-Grader tasters and the content of acidic compounds present in green coffee beans.
In the principal component analysis (PCA), the first component explained 66.9% of the variability, and the second component explained 33.1%, for a total of 99% of the explained variability (Figure 6). The samples with a high score for acidity, i.e., classified as excellent, that is, with a score higher than 7.75, had higher contents of 3,5-di-CQA chlorogenic acid, phosphoric acid and lactic acid but lower contents of malic acid and 5-FQA. For samples with acidity scores less than 7.25, classified as good acidity, the content of 4.5-di-CQA acid was higher with respect to that in samples with other classifications.
Table 5 shows the results of the multivariate t test. For samples with the highest con-tents of acidic compounds in the green coffee beans and with acidity scores higher than 7.75, 3,5-di-CQA (0.51 g 100 g−1), lactic acid (0.45 g kg−1) and phosphoric acid (0.56 g 100 g−1) contents were higher, and malic acid (3.82 g kg−1) and 5-FQA (0.36 g 100 g−1) contents were lower. For samples with acidity scores lower than 7.25, classified as good acidity, the content of 4.5-di-CQA acid was higher with respect to that in samples with other classifications (0.20 g 100 g−1).
Khapre et al. [42] found significant correlations (p < 0.05) between citric acid and the flavor and acidity attributes perceived in the beverage; however, in this study, there was not a statistically significant correlation between the citric acid content and the increase in the intensity of perceived acidity if citric acid was identified as the majority OA in green coffee beans (11.7 to 12.4 g kg−1, dwb). High contents of malic and citric acids contribute to the acidity of the beverage [32,53].
In the group of chlorogenic acids (Table 5), significant differences were also observed, with the content of the 3,5-di-CQA isomer being higher in the samples classified as having excellent acidity and statistically lower contents of the 3-CQA, 4-CQA and 5-FQA isomers. Dos Santos Scholz et al. [12] indicated that high values of 3,5-diCQA and 3,4-diCQA are indicators of ripe beans at harvest and result in positive beverage attributes.
Statistically significant differences were observed for samples with an acidity classified as excellent and green coffee beans with the highest phosphoric acid content (Table 5).
The Pearson correlation analysis (Figure 7) revealed that the contents of 3,5-di-CQA and 5-CQA have a direct linear relationship with acidity, with values of 0.26 and 0.27, respectively. For 3-CQA, 4-CQA and 4,5-CQA, there was an inverse relationship with acidity, with values of −0.36, −0.31 and −0.33, respectively; that is, higher contents of these compounds tend to be associated with lower acidity scores.
Barbosa et al. [32] indicated that although authors such as Farah et al. [43] have reported an association between high levels of CGA and lower cup quality, it is possible to obtain coffee beverages with good sensory quality from beans with different levels of CGAs.
For roasted Arabic coffees from different regions of Brazil, Zanin et al. [53] found wide variation in the total contents of CGA and 5-CQA in good quality coffee after different postharvest processing.
Figure 7 shows that the total SCA score is highly correlated with acidity (0.86), which is expected because this attribute is part of the total score. Osorio et al. [15] showed that the attributes most highly correlated with the total SCA score are acidity, flavor and balance, with values of 0.922, 0.894 and 0.881, respectively, which agrees with the results reported by Rune et al. [54], indicating that perceived acidity is not only associated with the content of OAs but also with other factors of the coffee process and other compounds present in green coffee beans.

4. Conclusions

This research explored the relationship between acidic chemical compounds and the sensory attribute of acidity, and the results indicate that acidity highly influences the perceived sensory quality of coffee, further contributing to the ability to differentiate the origins of Colombian coffee.
Lactic, 3,5-di-CQA and phosphoric acids are good discriminators of excellent acidity, and are associated with scores higher than 7.75 on the SCA classification scale, for green coffee beans with high contents of these compounds.
There was a direct linear relationship between acidity and 3,5-di-CQA and 5-CQA and an inverse relationship between acidity and 3-CQA, 4-CQA and 4,5-CQA.

Supplementary Materials

The following supporting information can be downloaded at https://www.mdpi.com/article/10.3390/separations11020052/s1: Table S1: Parameters of analytical methods of organic compounds—Repeatability; Figure S1: A. Chromatographic profile of the standard solution at 210 nm of citric acid (11.12 min), malic acid (13.16 min), quinic acid (13.72 min), succinic acid (16.29 min), lac-tic acid (16.65 min) and acetic acid 19.69 min) at 50 mg L−1. B. Chromatographic profile of the green coffee sample.; Table S2: Example of the calculations performed for the quantification of the samples.

Author Contributions

Conceptualization, formal analysis, investigation, data curation, writing—original draft preparation, L.F.E.-G.; review and editing, V.O.P.; and formal analysis, L.C.I.Q., C.T.A. and L.J.V.G. All authors have read and agreed to the published version of the manuscript.

Funding

This research was funded by Contract No. 2019 02 1486 for the development of scientific and technological activities, signed between the Department of Cesar and the National Federation of Coffee Growers of Colombia for the purpose of “Experimental Development for the improvement of the Competitiveness of the coffee sector of the Department of Cesar”, code BPIN 2017000100036, financed by the Fund for Science, Technology and Innovation-FCTeI, of the General System of Royalties—SGR and National Coffee Research Center (Cenicafé) project number CAL101006.

Data Availability Statement

Data are contained within the article and Supplementary Materials.

Acknowledgments

The authors gratefully acknowledge Principal Álvaro Gaitán of Cenicafé; colleagues Juan Camilo Espinosa, Lina Maria Gonzalez Cadavid, Jenny Paola Pabón, Jamir Rodriguez Palencia, Heli Santiago Castaño, Carlos Gonzalo Mejia, Beatriz Mira, Miguel Castiblanco and Rubén Medina; and the support staff Erika Patricia Corredor, Paola Calderon, Wilson Vargas and Víctor Castañeda.

Conflicts of Interest

The authors declare no conflict of interest.

References

  1. Federación Nacional de Cafeteros. Producción Anual de Café de Colombia; FNC: Bogotá, Colombia, 2023. [Google Scholar]
  2. Ministerio de Agricultura y Desarrollo Rural. Agronet Reporte: Área, Producción y Rendimiento Nacional Por Cultivo; Agronet: Bogotá, Colombia, 2021. [Google Scholar]
  3. Giraldo-Jaramillo, M.; Montoya, E.C.; Sarmiento-Herrera, N.; Mosquera, A.Q.; Espinosa-Osorio, J.C.; García-López, J.C.; Orrego, H.D.; Machado, P.B. Vulnerabilidad de la caficultura de los departamentos de Cesar, La Guajira y Bolívar a la broca del café en diferentes eventos climáticos. Av. Técnicos Cenicafé 2021, 527, 1–8. [Google Scholar] [CrossRef]
  4. Barbosa, J.N.; Borem, F.M.; Cirillo, M.A.; Malta, M.R.; Alvarenga, A.A.; Alves, H.M.R. Coffee Quality and Its Interactions with Environmental Factors in Minas Gerais, Brazil. JAS 2012, 4, 181. [Google Scholar] [CrossRef]
  5. Bunn, C.; Läderach, P.; Ovalle Rivera, O.; Kirschke, D. A Bitter Cup: Climate Change Profile of Global Production of Arabica and Robusta Coffee. Clim. Change 2015, 129, 89–101. [Google Scholar] [CrossRef]
  6. Figueiredo, L.P.; Borém, F.M.; Ribeiro, F.C.; Giomo, G.S.; Henrique da Silva Taveira, J.; Malta, M.R. Fatty Acid Profiles and Parameters of Quality of Specialty Coffees Produced in Different Brazilian Regions. Afr. J. Agric. Res. 2015, 10, 3484–3493. [Google Scholar] [CrossRef]
  7. Arcila Pulgarín, J. Densidad de Siembra y Productividad de Los Cafetales. In Sistemas de producción de café en Colombia; Arcila Pulgarín, J., Farfan, F., Moreno., A., Salazar, L., Hincapie, E., Eds.; Cenicafé: Manizales, Colombia, 2007; pp. 131–144. [Google Scholar]
  8. Ramirez, V.H.; Jaramillo, A.; Arcila, J. Rangos Adecuados de Lluvia Para El Cultivo de Café En Colombia. Av. Técnicos Cenicafé 2013, 395, 1–8. [Google Scholar]
  9. Flórez, C.P.; Arias, J.C.; Orrego, H.D. Guía para la caracterización de las variedades de café: Claves para su identificación. Av. Técnicos Cenicafé 2017, 476, 1–12. [Google Scholar] [CrossRef]
  10. Alvarado, G.; Moreno, E.; Montoya, E.C.; Alarcon, R. Calidad física y En Taza de Los Componentes de La Variedad Castillo® y Sus Derivadas Regionales. Rev. Cenicafé 2009, 60, 210–228. Available online: https://www.cenicafe.org/es/publications/arc060%2803%29210-228.pdf (accessed on 23 July 2023).
  11. Cheng, B.; Furtado, A.; Smyth, H.E.; Henry, R.J. Influence of Genotype and Environment on Coffee Quality. Trends Food Sci. Technol. 2016, 57, 20–30. [Google Scholar] [CrossRef]
  12. dos Santos Scholz, M.B.; de Figueiredo, V.R.G.; da Silva, J.V.N.; Kitzberger, C.S.G. Sensory Atributes and Physico-Chemical Characteristics of the Coffee Beverage from the IAPAR Cultivars. Coffee Sci. 2013, 8, 6–16. [Google Scholar]
  13. Peñuela-Martínez, A.E.; Sanz-Uribe, J.R. Obtenga café de calidad en el proceso de beneficio. In Guía Más Agronomia, Más Productividad, Más Calidad; Cenicafé: Manizales, Colombia, 2021; pp. 189–218. Available online: https://coffeescience.ufla.br/index.php/Coffeescience/article/view/297 (accessed on 23 July 2023).
  14. Osorio, V. La calidad del Café. In Guía Más Agronomia, Más Productividad, Más Calidad; Cenicafé: Manizales, Colombia, 2021; pp. 219–234. [Google Scholar]
  15. Osorio, V.; Álvarez-Barreto, C.I.; Matallana, L.G.; Acuña, J.R.; Echeverri-Giraldo, L.F.; Imbachí, L.C. Effect of Prolonged Fermentations of Coffee Mucilage with Different Stages of Maturity on the Quality and Chemical Composition of the Bean. Fermentation 2022, 8, 519. [Google Scholar] [CrossRef]
  16. Osorio, V.; Pabón, J.; Shuler, J.; Fernández-Alduenda, M.R. Efecto de la combinación de procesos de secado en la calidad del café natural obtenido vía seca. Rev. Cenicafé 2022, 73, e73101. [Google Scholar] [CrossRef]
  17. Puerta-Quintero, G.I. Influencia de los Granos de Café Cosechados Verdes en la Calidad Física y Organoléptica de la Bebida. Rev. Cenicafé 2000, 51, 136–150. Available online: https://www.cenicafe.org/es/publications/arc051(02)136-150.pdf (accessed on 23 July 2023).
  18. Peñuela-Martínez, A.E.; Guerrero, A.; Sanz-Uribe, J.R. Cromacafé® Herramienta para identificar los estados de madurez de las variedades de café de fruto rojo. Av. Técnicos Cenicafé 2022, 535, 1–8. [Google Scholar] [CrossRef]
  19. Guerrero, A.; Sanz-Uribe, J.R.; Peñuela-Martínez, A.E.; Ramírez, C.A. Mediverdes®: Un método para medir la calidad de la recolección del café en el campo. Av. Técnicos Cenicafé 2022, 536, 1–8. [Google Scholar] [CrossRef]
  20. Álvarez, J. Despulpado de Café Sin Agua. Av. Técnicos Cenicafé 1991, 164, 1–6. [Google Scholar]
  21. Peñuela-Martínez, A.E.; Pabon, J.; Rodriguez, N.; Oliveros, C.E. Evaluación de una enzima pectinolítica para el desmucilaginado del café. Rev. Cenicafé 2010, 61, 241–250. Available online: https://www.cenicafe.org/es/publications/arc061(03)241-251.pdf (accessed on 23 July 2023).
  22. Oliveros, C.E.; Roa, G. El Desmucilaginado Mecánico Del Café. Av. Técnicos Cenicafé 1995, 216, 1–7. [Google Scholar] [CrossRef]
  23. Oliveros, C.E.; Sanz, J.R.; Ramirez, C.A.; Tibaduiza, C.A. ECOMILL: Tecnología de bajo impacto ambiental para el lavado del café. Av. Técnicos Cenicafé 2013, 432, 1–8. [Google Scholar] [CrossRef]
  24. Peñuela-Martínez, A.E.; Pabon, J.; Oliveros, C.E. Enzimas: Una alternativa para remover rápida y eficazmente el mucílago del café. In Av. Técnicos Cenicafé 2011, 406, 1–8. [Google Scholar] [CrossRef]
  25. Puerta-Quintero, G.I. Influencia del proceso de beneficio en la calidad del café. Rev. Cenicafé 1999, 50, 78–88. Available online: https://biblioteca.cenicafe.org/bitstream/10778/58/1/arc050%2801%29078-088.pdf (accessed on 23 July 2023).
  26. Peñuela-Martínez, A.E.; Pabon, J.; Sanz, J.R. Método Fermaestro: Para Determinar La Finalización de La Fermentación Del Mucílago de Café. Av. Técnicos Cenicafé 2013, 431, 1–8. [Google Scholar] [CrossRef]
  27. Puerta-Quintero, G.I. La humedad controlada del grano preserva la calidad del café. Av. Técnicos Cenicafé 2006, 352, 1–8. [Google Scholar]
  28. Oliveros, C.E.; Peñuela-Martínez, A.E.; Jurado, J.M. Controle la humedad del café en el secado solar utilizando el método Gravimet. Av. Técnicos Cenicafé 2009, 387, 1–8. [Google Scholar]
  29. Oliveros, C.E.; Peñuela-Martínez, A.E.; Pabon, J.P. Gravimet SM: Tecnología para medir la humedad del café en el secado en silos. Av. Técnicos Cenicafé 2013, 433, 1–8. [Google Scholar] [CrossRef]
  30. Puerta, G.I.; Echeverri-Giraldo, L.F. Relaciones Entre Las Concentraciones de Compuestos Químicos Del Café y Las Temperaturas de Torrefacción. Rev. Cenicafé 2019, 70, 67–80. Available online: https://biblioteca.cenicafe.org/bitstream/10778/4217/1/arc070%283%29067-080.pdf (accessed on 23 July 2023).
  31. Osorio, V.; Pabón, J.; Gallego, C.P.; Echeverri-Giraldo, L.F. Efecto de las temperaturas y tiempos de tueste en la composición química del café. Rev. Cenicafé 2021, 72, e72103. [Google Scholar] [CrossRef]
  32. Barbosa, M.d.S.G.; Scholz, M.B.d.S.; Kitzberger, C.S.G.; Benassi, M.d.T. Correlation between the Composition of Green Arabica Coffee Beans and the Sensory Quality of Coffee Brews. Food Chem. 2019, 292, 275–280. [Google Scholar] [CrossRef]
  33. Ribeiro, D.E.; Borem, F.M.; Cirillo, M.A.; Prado, M.V.B.; Ferraz, V.P.; Alves, H.M.R.; da Silva Taveira, J.H. Interaction of Genotype, Environment and Processing in the Chemical Composition Expression and Sensorial Quality of Arabica Coffee. Afr. J. Agric. Res. 2016, 11, 2412–2422. [Google Scholar] [CrossRef]
  34. Woodman, J.S. Carboxylic Acids. In Coffee; Springer: Berlin/Heidelberg, Germany, 1985; pp. 266–289. [Google Scholar] [CrossRef]
  35. Borém, F.M.; Figueiredo, L.P.; Ribeiro, F.C.; Taveira, J.H.; Giomo, G.S.; Salva, T.J. The Relationship between Organic Acids, Sucrose and the Quality of Specialty Coffees. Afr. J. Agric. Res. 2016, 11, 709–717. [Google Scholar] [CrossRef]
  36. Santiago, W.D.; Teixeira, A.R.; Santiago, J.D.A.; Lopes, A.C.A.; Brandão, R.M.; Caetano, A.R.; Cardoso, M.D.G.; Resende, M.L.V. Development and Validation of Chromatographic Methods to Quantify Organic Compounds in Green Coffee (Coffea arabica) Beans. Aust. J. Crop. Sci. 2020, 1275–1282. [Google Scholar] [CrossRef]
  37. Yeager, S.E.; Batali, M.E.; Guinard, J.-X.; Ristenpart, W.D. Acids in Coffee: A Review of Sensory Measurements and Meta-Analysis of Chemical Composition. Crit. Rev. Food Sci. Nutr. 2023, 63, 1010–1036. [Google Scholar] [CrossRef]
  38. Marin, C.; Puerta-Quintero, G.I. Contenido de ácidos clorogénicos en granos de Coffea arabica L y C. canephora según el desarrollo del fruto. Rev. Cenicafé 2008, 59, 7–28. Available online: https://biblioteca.cenicafe.org/bitstream/10778/60/1/arc059%2801%2907-28.pdf (accessed on 23 July 2023).
  39. Cortés-Macías, E.T.; López, C.F.; Gentile, P.; Girón-Hernández, J.; López, A.F. Impact of Post-Harvest Treatments on Physicochemical and Sensory Characteristics of Coffee Beans in Huila, Colombia. Postharvest Biol. Technol. 2022, 187, 111852. [Google Scholar] [CrossRef]
  40. Kulapichitr, F.; Borompichaichartkul, C.; Fang, M.; Suppavorasatit, I.; Cadwallader, K.R. Effect of Post-Harvest Drying Process on Chlorogenic Acids, Antioxidant Activities and CIE-Lab Color of Thai Arabica Green Coffee Beans. Food Chem. 2022, 366, 130504. [Google Scholar] [CrossRef] [PubMed]
  41. Ribeiro, D.E.; Borém, F.M.; Nunes, C.A.; Alves, A.P.D.C.; Santos, C.M.D.; Taveira, J.H.D.S.; Dias, L.L.D.C. Profile of Organic Acids and Bioactive Compounds in the Sensory Quality Discrimination of Arabica Coffee. Coffee Sci. 2018, 13, 187–197. Available online: https://coffeescience.ufla.br/index.php/Coffeescience/article/view/1415/PDF1415 (accessed on 23 July 2023). [CrossRef]
  42. Khapre, Y.; Kyamuhangire, W.; Njoroge, E.K.; Kathurima, C.W. Analysis of the diversity of some arabica and robusta coffee from kenya and uganda by sensory and biochemical components and their correlation to taste. IOSR-JESTFT 2017, 11, 2319–2399. [Google Scholar]
  43. Farah, A.; Monteiro, M.C.; Calado, V.; Franca, A.S.; Trugo, L.C. Correlation between Cup Quality and Chemical Attributes of Brazilian Coffee. Food Chem. 2006, 98, 373–380. [Google Scholar] [CrossRef]
  44. Supelco. Application Note 21: Separation of Organic Acids in Beverages Using a SUPELCOGELTM C-610H HPLC Column. Supelco: Bellefonte, Pennsylvania, Estados Unidos. 1995. Available online: https://www.mercklifescienceth.com/product/pdf/59320-U.pdf (accessed on 23 July 2023).
  45. Carrillo, I.F. Manual de Laboratorio de Suelos; Cenicafe: Manizales, Caldas, 1985; Available online: https://biblioteca.cenicafe.org/handle/10778/803 (accessed on 7 December 2023).
  46. Schrader, K.; Kiehne, A.; Engelhardt, U.H.; Gerhard Maier, H. Determination of Chlorogenic Acids with Lactones in Roasted Coffee. J. Sci. Food Agric. 1996, 71, 392–398. [Google Scholar] [CrossRef]
  47. Trugo, L.C.; Macrae, R. Chlorogenic Acid Composition of Instant Coffees. Analyst 1984, 109, 263–266. [Google Scholar] [CrossRef]
  48. SCA. S/f. SCA Research: Protocols & Best Practices. Separations. Available online: https://sca.coffee/research/protocols-best-practices (accessed on 8 September 2023).
  49. Peñuela-Martínez, A.E.; Moreno-Riascos, S.; Medina-Rivera, R. Influence of Temperature-Controlled Fermentation on the Quality of Mild Coffee (Coffea arabica L.) Cultivated at Different Elevations. Agriculture 2023, 13, 1132. [Google Scholar] [CrossRef]
  50. Amalia, F.; Aditiawati, P.; Yusianto; Putri, S.P.; Fukusaki, E. Gas Chromatography/Mass Spectrometry-Based Metabolite Profiling of Coffee Beans Obtained from Different Altitudes and Origins with Various Postharvest Processing. Metabolomics 2021, 17, 69. [Google Scholar] [CrossRef]
  51. Dong, R.; Zhu, M.; Long, Y.; Yu, Q.; Li, C.; Xie, J.; Huang, Y.; Chen, Y. Exploring Correlations between Green Coffee Bean Components and Thermal Contaminants in Roasted Coffee Beans. Food Res. Int. 2023, 167, 112700. [Google Scholar] [CrossRef] [PubMed]
  52. SCA. What Is Specialty Coffee? Available online: https://sca.coffee/research/what-is-specialty-coffee (accessed on 8 September 2023).
  53. Zanin, R.C.; Corso, M.P.; Kitzberger, C.S.G.; Scholz, M.B.D.S.; Benassi, M.D.T. Good Cup Quality Roasted Coffees Show Wide Variation in Chlorogenic Acids Content. LWT 2016, 74, 480–483. [Google Scholar] [CrossRef]
  54. Rune, C.J.B.; Giacalone, D.; Steen, I.; Duelund, L.; Münchow, M.; Clausen, M.P. Acids in Brewed Coffees: Chemical Composition and Sensory Threshold. Curr. Res. Food Sci. 2023, 6, 100485. [Google Scholar] [CrossRef] [PubMed]
Figure 1. Location of farms and sample processing: (a) Geographical location of the farms; (b) sample processing.
Separations 11 00052 g001
Figure 2. Chromatographic profile of the standard solution at 210 nm of citric acid (11.12 min), malic acid (13.16 min), quinic acid (13.72 min), succinic acid (16.29 min), lactic acid (16.65 min) and acetic acid 19.69 min) at 50 mg L−1. Diamond indicates that a fitting parameter was added to improve separation. Triangles indicate the start and end of integration.
Separations 11 00052 g002
Figure 3. Calibration curve for phosphoric acid content assay.
Separations 11 00052 g003
Figure 4. UPLC–DAD chromatogram of chlorogenic acids in green coffee beans of C. arabica. 3-CQA: 0.75 min; 5-CQA:0.98 min; 4-CQA: 1.04 min; 4-FQA:1.32 min; 5-FQA: 1.52 min; 3,4-di-CQA: 2.14 min; 3,5-diCQA: 2.18 min; 4,5-diCQA: 2.24 min. Triangles indicate the start and end of integration.
Separations 11 00052 g004
Figure 5. Classification of samples based on the sensory evaluation results.
Separations 11 00052 g005
Figure 6. Principal component analysis biplot of Dim1 and Dim2 for the dataset of chemical compounds in green coffee beans and acidity in the cup.
Separations 11 00052 g006
Figure 7. Pearson Correlation between Acidity and Chemical Compounds. * p < 0.05, ** p < 0.01, *** p < 0.001.
Separations 11 00052 g007
Table 1. Parameters of analytical methods of organic compounds.
Compound
Acid
Retention Time
(min)
EquationRegression Coefficient
(R2)
Working
Range
mg/L
LOD
(mg/L)
LOQ
(mg/L)
Acetic19.69y = 1.42 × 10³x − 7.56 × 1020.995850–5005.0016.67
Citric11.12y = 2.44 × 10³x − 7.74 × 1030.999960–960 6.0020.00
Lactic16.65y = 4.47 × 10³x + 3.96 × 1030.99556–960.602.00
Malic13.16y = 1.68 × 10³x − 6.12 × 1030.999690–4509.0030.00
Quinic13.72y = 1.09 × 10³x − 3.67 × 1030.9994180–90018.0060.00
Succinic16.29y = 1.33 × 10³x − 4.94 × 1030.997020–1004.0012.00
Table 2. Average acid content in green coffee beans (dry weight basis (dwb)).
ParameterHarvest 1 (2021)
Mean ± Sd
Harvest 2 (2022)
Mean ± Sd
General Mean ± Sd
Phosphoric acid (H3PO4) 10.53 ± 0.050.52 ± 0.050.53 ± 0.05
Organic Acids 2
Acetic4 ± 32.2 ± 0.73.2 ± 2.6
Citric12.3 ± 1.611.9 ± 1.512.1 ± 1.6
Lactic0.48 ± 0.110.27 ± 0.020.37 ± 0.13
Malic4.3 ± 0.84.5 ± 0.84.4 ± 0.8
Quinic6.4 ± 0.75.5 ± 0.56 ± 0.8
Succinic1.6 ± 0.81.7 ± 0.61.6 ± 0.7
Chlorogenic Acids 1
Caffeoylquinic acid (CQA)5.44 ± 0.355.70 ± 0.335.57 ± 0.36
3-caffeoylquinic acid (3-CQA)0.34 ± 0.100.35 ± 0.080.35 ± 0.09
4-caffeoylquinic acid (4-CQA)0.52 ± 0.100.54 ± 0.080.53 ± 0.09
5-caffeoylquinic acid (5-CQA)4.58 ± 0.324.81 ± 0.294.70 ± 0.33
Dicaffeoylquinic acids (di-CQA)0.73 ± 0.090.73 ± 0.100.73 ± 0.10
3,4-dicaffeoylquinic acid (3,4-diCQA)0.13 ± 0.030.14 ± 0.060.13 ± 0.05
3,5-dicaffeoylquinic acid (3,5-diCQA)0.40 ± 0.100.40 ± 0.120.40 ± 0.11
4,5-dicaffeoylquinic acid (4,5-diCQA)0.20 ± 0.040.19 ± 0.040.19 ± 0.04
Feruloylquinic acids (FQA)0.38 ± 0.030.46 ± 0.140.40 ± 0.04
4-feruloylquinic acid (4-FQA)0.03 ± 0.010.03 ± 0.010.03 ± 0.01
5-feruloylquinic acid (5-FQA)0.35 ± 0.030.39 ± 0.030.37 ± 0.04
Sd: Standard deviation. 1 g 100 g−1 green coffee bean. 2 g kg−1 green coffee bean.
Table 3. Results of the sensory analysis by attribute.
AttributesMean ± SdMinimumMaximum
Fragrance/Aroma7.57 ± 0.216.888.25
Flavor7.54 ± 0.247.008.35
Aftertaste7.38 ± 0.227.008.12
Acidity7.52 ± 0.27.008.25
Bodysuit7.48 ± 0.197.008.13
Balance7.45 ± 0.27.008.00
Overall7.49 ± 0.277.009.00
Sd: Standard deviation.
Table 4. Classification scale for acidity.
Score RangeQuality Classification
≥7.00–<7.25Good
≥7.25–<7.75Very good
≥7.75Excellent
Table 5. Average content of acidic compounds based on acidity classification. Different letters indicate significant differences according to the 5% multivariate t test.
Acid GroupAcidity Classification
GoodVery GoodExcellent
≥7.00–<7.25≥7.25–<7.75≥7.75
Phosphoric acid (H3PO4) 20.52 ± 0.04 b0.53 ± 0.05 b0.56 ± 0.05 a
Organic acids 1
Citric12.4 ± 1.5 a11.7 ± 1.5 a12 ± 1.5 a
Lactic0.37 ± 0.13 b0.32 ± 0.11 b0.45 ± 0.13 a
Malic4.5 ± 0.8 a4.5 ± 0.8 a3.8 ± 0.8 b
Quinic6 ± 0.7 ab 5.7 ± 0.7 b6.1 ± 0.8 a
Succinic1.7 ± 0.6 a1.6 ± 0.7 a1.6 ± 0.7 a
Isomers of CGA 2
3-CQA0.36 ± 0.09 a0.32 ± 0.08 a0.26 ± 0.07 b
4-CQA0.55 ± 0.09 a0.51 ± 0.09 a0.45 ± 0.08 b
5-CQA4.69 ± 0.31 a4.81 ± 0.31 a4.81 ± 0.30 a
3,4-di-CQA0.14 ± 0.04 a0.13 ± 0.06 a0.12 ± 0.03 a
3,5-di-CQA0.40 ± 0.10 b0.42 ± 0.11 b0.51 ± 0.10 a
4,5-di-CQA0.20 ± 0.04 a0.18 ± 0.04 b0.17 ± 0.03 b
4-FQA0.03 ± 0.01a0.03 ± 0.01 a0.03 ± 0.01 a
5-FQA0.37 ± 0.03 a0.37 ± 0.04 a0.36 ± 0.03 b
1 g kg −1 green coffee bean on a dry basis. 2 g 100 g −1 green coffee bean on a dry basis.
Disclaimer/Publisher’s Note: The statements, opinions and data contained in all publications are solely those of the individual author(s) and contributor(s) and not of MDPI and/or the editor(s). MDPI and/or the editor(s) disclaim responsibility for any injury to people or property resulting from any ideas, methods, instructions or products referred to in the content.

